Command Line Interface (CLI)
Table of Contents
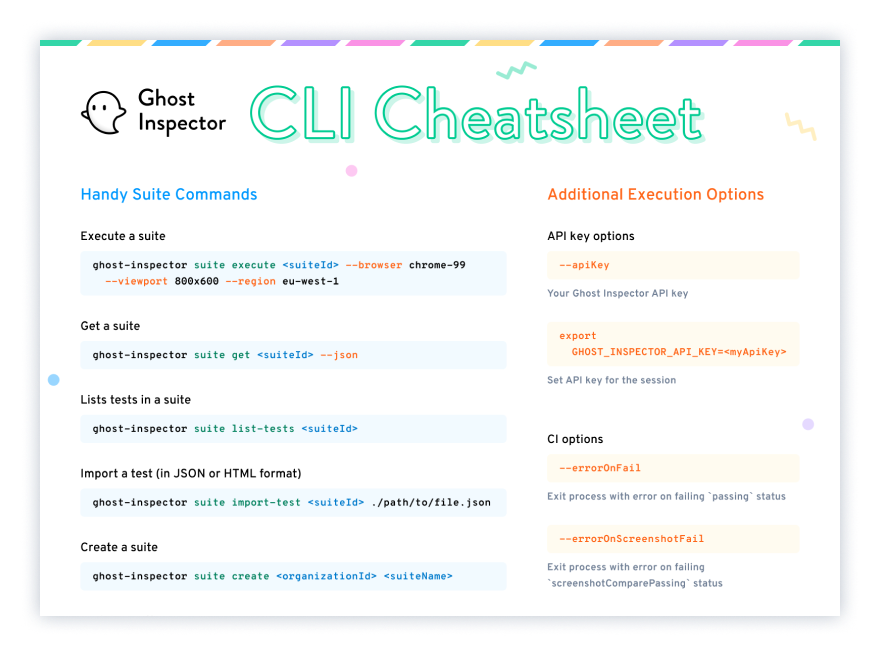
CLI Cheatsheet
Getting Started
Install via NPM
Ghost Inspector offers a Command Line Interface (CLI) to simplify the process of scripting interactions with the Ghost Inspector API. Get started by installing the CLI using npm:
npm install -g ghost-inspector
Alternatively, if you are unable to install the ghost-inspector package globally you can execute the package directly using npx:
npx ghost-inspector {{command}}
Docker image
If you would like to test an application running in a Docker environment, you can use our Docker image to execute your suite against the application.
# Pull and run the CLI docker image
docker run ghostinspector/cli test execute ...
Pre-compiled binary
We also offer a few pre-compiled binaries for scenarios where you are unable to install NPM or do not have access to the Docker daemon. Binaries are currently available for Linux and Windows.
Download the Linux binary
# Download the CLI
curl -sL https://github.com/ghost-inspector/node-ghost-inspector/releases/latest/download/ghost-inspector-linux \
  --output ./ghost-inspector

# Make it executable
chmod +x ghost-inspector
Download using PowerShell
# Download the exe
Invoke-WebRequest -Uri "https://github.com/ghost-inspector/node-ghost-inspector/releases/latest/download/ghost-inspector.exe"
  -OutFile "C:\MyPath\ghost-inspector.exe"
Setting Up Your API Key
There are two options for setting your API key when using the CLI. The first is to set the API key using an environment variable. Once this is set, the CLI will load the API key from the environment for the remainder of the session:
export GHOST_INSPECTOR_API_KEY={{my-api-key}}
You can also pass the API key to CLI commands explicitly:
ghost-inspector {{command}} --apiKey={{my-api-key}}
Executing Your First Test
Now you can execute a test simply with the following command. When it returns it will output the result that was executed along with it's status:
ghost-inspector test execute {{my-test-id}}
✓ Result: My test (200000000000000000000001)
By default the command will wait for the test execution to complete before returning. You can prompt the command to return immediately with the --immediate flag:
ghost-inspector test execute {{my-test-id}} --immediate
? Result: My test (200000000000000000000002)
Using the result ID provided in parenthesis (200000000000000000000002) you can manually wait for the execution to complete:
ghost-inspector result wait 200000000000000000000002
✓ Result: My test (200000000000000000000002)
Additional Examples
Execute using Multiple Browsers, Regions & Viewports
The following command will create and execute a total of 8 results using every combination of browser, region and viewport provided:
ghost-inspector test execute {{test-id}} \
  --browser chrome --browser firefox \
  --region us-east-1 --region ap-south-1 \
  --viewport 1024x768 --viewport 800x600 \
  --immediate
Since specific browser versions are not specified, the latest version of each browser will be used.
Note: If you have a data source
assigned to your test or suite, any combination of browser, region or viewport provided will be
multiplied against the number of rows within your data source and could result in many executions.
Execute with Local VPN Tunnel
The CLI comes with support for creating ngrok secure local VPN tunnels for the duration of your execution. This example creates a tunnel to a locally-accessible application and executes a test against it. By default a variable will be available within your test called {{ ngrokUrl }} which is the public URL of the tunnel. You can customize the name of this variable with the option --ngrokUrlVariable. You can also specify the host header rewrite by specifying the option --ngrokHostHeader:
ghost-inspector test execute {{test-id}} \
  --ngrokTunnel 192.168.2.15:8080 \
  --ngrokUrlVariable startUrl \
  --ngrokHostHeader my-website.com \
  --ngrokToken {{my-ngrok-token}}
Execute with CSV
This example provides a path to a local CSV file to execute using data-driven testing and limits test execution concurrency to 5 test runs at a time:
ghost-inspector test execute {{test-id}} \
  --maxConcurrentDataRows 5 \
  --dataFile ./my-local-file.csv
Passing Variables
The parameters --firstName and --last-name from this example will be available in your test as the variables {{ firstName }} and {{ last-name }}, notice that both --camelCase and --kebab-case are supported for custom variables:
ghost-inspector test execute {{test-id}} \
  --startUrl "https://my-website.com" \
  --firstName Rodavan
  --last-name Petrović
  --immediate
Providing JSON Input
It is also possible to provide raw JSON input for command options:
ghost-inspector test execute {{test-id}} \
  --jsonInput '{"startUrl": "https://my-website.com", "firstName": "Rodavan", "last-name": "Petrović", "immediate": true}'
Toggle JSON Output
It is possible to chain together sophisticated scripts by using the output from one command as the input as the next command. By default the CLI will provide human-readable output from each command however you can toggle the raw JSON output from the commands if you wish to combine that with another utility like jq:
# create a new suite
newSuiteId=$(ghost-inspector suite create {{org-id}} "My suite name" --json | jq -r '._id')

# duplicate an existing test
newTestId=$(ghost-inspector test duplicate {{test-id}} --json | jq -r '._id')

# update the new test and move it to the new suite
ghost-inspector test update $newTestId \
  --name "My new test name" \
  --startUrl "https://some-new-url.com" \
  --suite $newSuiteId

# execute the new test
resultId=$(ghost-inspector test execute $newTestId --json --immediate | jq -r '._id')

# wait for the result, exiting with non-0 status
# if the result fails (see "CI Modes")
ghost-inspector result wait $resultId --errorOnFail
Get Running Test Count
Fetch the number of tests currently running for an organization:
ghost-inspector organization get-running {{org-id}} --json | jq '. | length'
CI Modes
By default when executing a test or suite the CLI command will exit with a 0 exit code, regardless of the status of the test or suite. This can be problematic in a Continuous Integration environment where you expect a failing command to stop your bulid. To accommodate this, the CLI provides the ability to modify this behaviour for either a failing status or failing screenshot status:
# exit with non-0 status when test is failing
ghost-inspector test execute {{test-id}} --errorOnFail

# exit with non-0 status when screenshot is failing
ghost-inspector test execute {{test-id}} --errorOnScreenshotFail

# exit with non-0 status when either status or screenshot is failing
ghost-inspector test execute {{test-id}} --errorOnFail --errorOnScreenshotFail
The CI Modes flag are also available for the ghost-inspector suite execute and ghost-inspector result wait commands.
Getting Help
CLI help is available at all command levels:
# top-level command help
ghost-inspector --help

# entity-level help
ghost-inspector suite --help

# command-specific help
ghost-inspector test execute --help